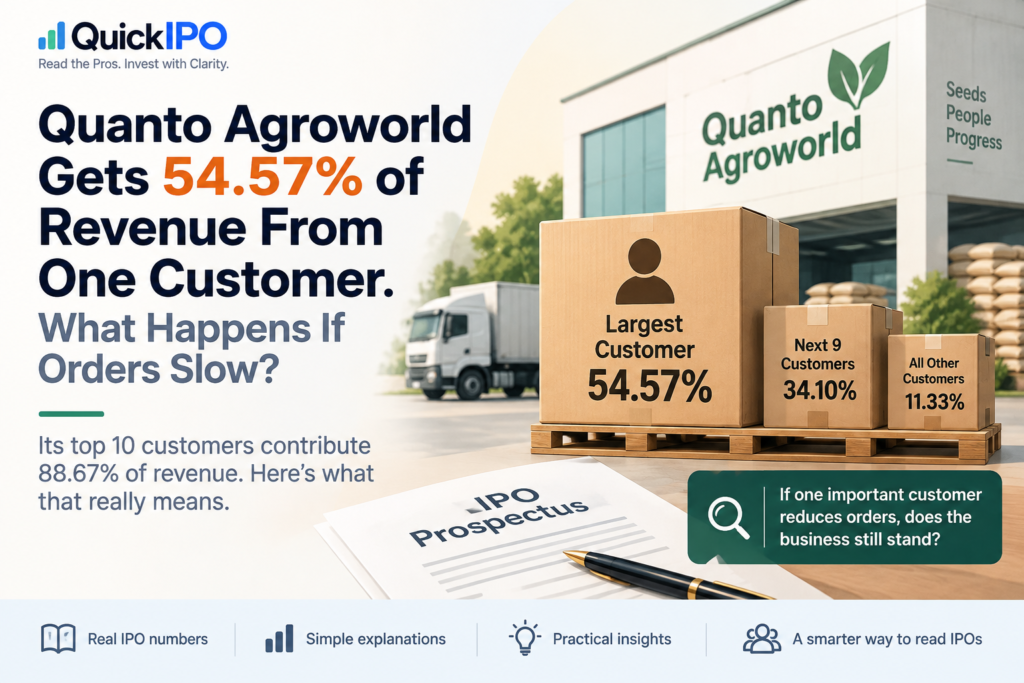
Quanto Agroworld reported about ₹40.35 crore of revenue from operations in FY26.
That number by itself does not look unusual for a small company coming to the SME market.
Then we reached one table in the prospectus.
One customer alone contributed 54.57% of Quanto’s FY26 revenue.
Its top five customers contributed 85.49%.
Its top ten customers contributed 88.67%.
Put away the finance terminology for a moment.
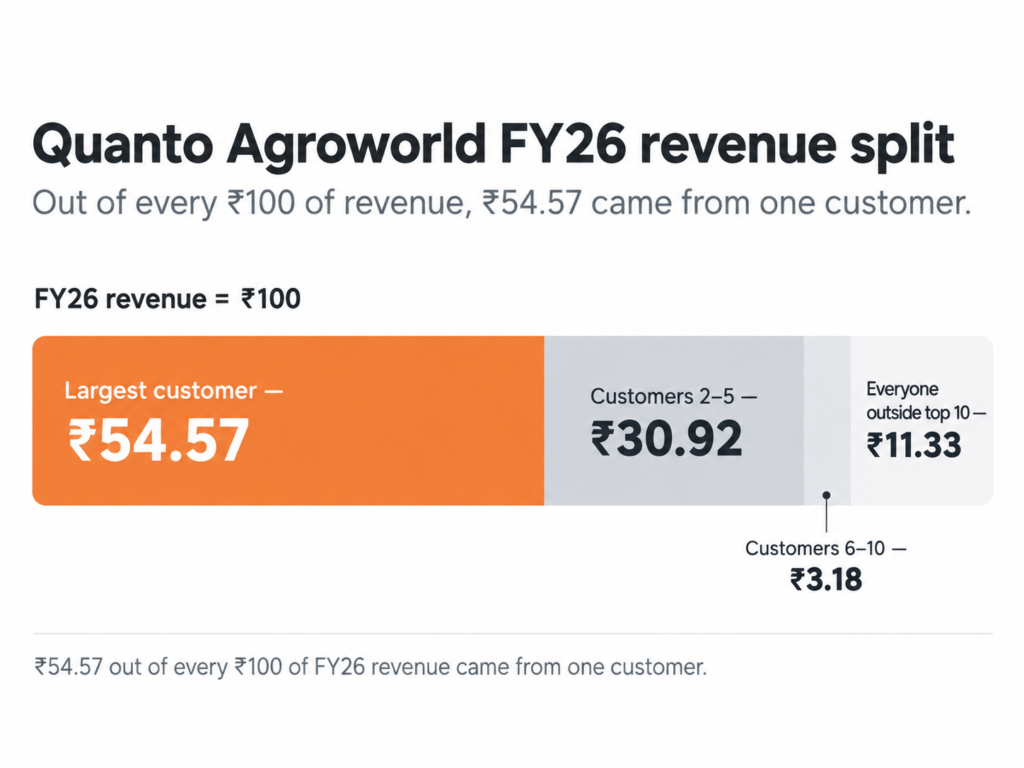
If Quanto earns ₹100, roughly ₹54.57 comes from one customer.
So here is the useful question: if that customer reduces its orders, what happens to the business?
That question is much more useful than simply asking whether “54.57% customer concentration is good or bad”.
Let’s understand why.
First, what does customer concentration actually mean?
Imagine you run a tea shop.
One hundred people buy tea from you every morning. If three customers stop coming tomorrow, you probably do not notice much.
Now imagine a different business.
You manufacture a specialised product for ten companies, but one company gives you more than half your annual sales.
That customer is no longer just a customer.
It has become an important part of your business model.
This is what investors mean when they talk about customer concentration.
The higher the share of revenue coming from a small number of customers, the more important those relationships can become to future sales, margins, working capital and cash flow.
But there is no magic percentage at which a business suddenly becomes “safe” or “unsafe”.
A number such as 50%, 70% or 90% is only the beginning of the investigation.
₹22 crore from one customer
Quanto’s FY26 revenue from operations was approximately ₹40.35 crore.
The prospectus says its largest customer contributed approximately ₹22.02 crore.
That works out to 54.57% of revenue from operations.
Think about what that means.
One relationship generated more revenue than all the company’s other customers combined.
That does not mean the customer is going to leave.
There is no evidence in the prospectus saying that.
What it does mean is that a meaningful change in purchases from this customer could have a meaningful effect on Quanto’s business unless the lost sales are replaced elsewhere.
But Top 10 = 88.67% does not tell the full story
Suppose I told you:
“A company’s top ten customers generate 89% of its revenue.”
That sounds concentrated.
But I still have not told you the most important part.
How much does the largest customer contribute?
Consider two imaginary businesses.
| Company A | Company B | |
|---|---|---|
| Largest customer | 55% | 15% |
| Customers 2–10 | 34% | 74% |
| Top 10 total | 89% | 89% |
The headline concentration is identical.
The dependence is not.
Company A has an obvious single point of dependence.
Company B is also concentrated, but the revenue is spread across more relationships.
This is why, whenever we see customer concentration in an IPO, we prefer to examine:
Top 1 → Top 3 → Top 5 → Top 10
One headline percentage can hide a lot.
Now look at Quanto over three years
This is where the prospectus becomes even more useful.
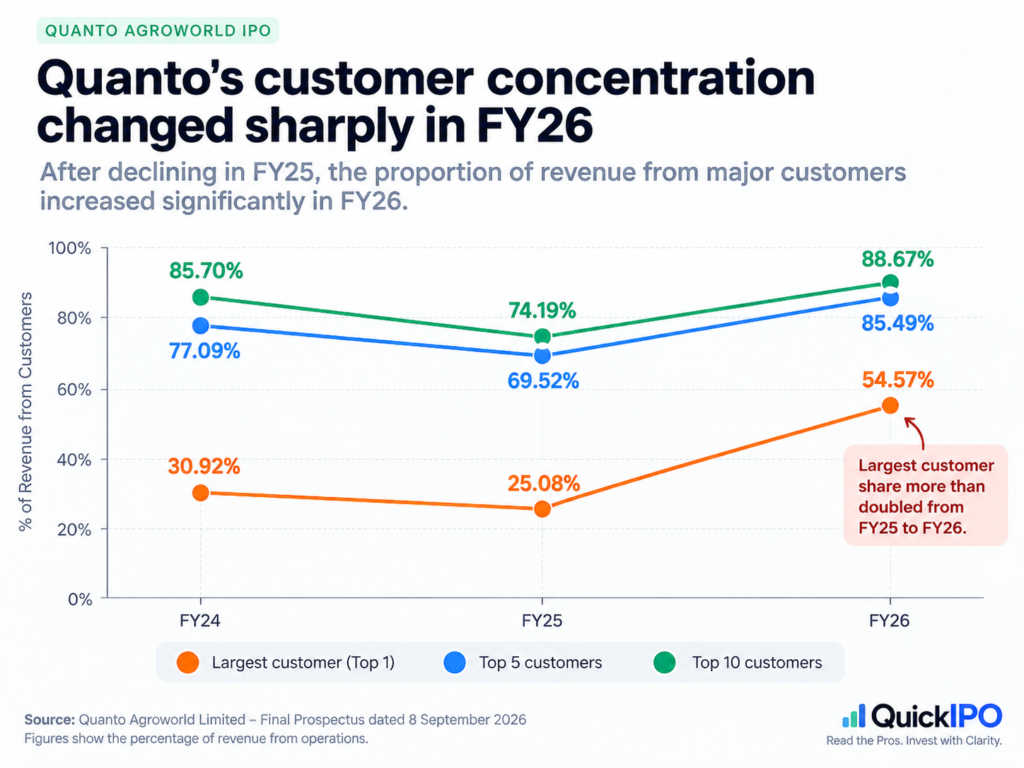
| Customer concentration | FY24 | FY25 | FY26 |
|---|---|---|---|
| Largest customer | 30.92% | 25.08% | 54.57% |
| Top 5 customers | 77.09% | 69.52% | 85.49% |
| Top 10 customers | 85.70% | 74.19% | 88.67% |
Look at the direction.
In FY25, concentration actually reduced.
The largest customer’s contribution fell from 30.92% to 25.08%. Top-5 concentration fell from 77.09% to 69.52%.
Then FY26 changed the picture.
The largest customer’s share jumped to 54.57%, while Top-5 concentration rose to 85.49%.
That gives us a much better question than simply saying “concentration is high”.
Why did dependence on the largest customer increase so sharply in FY26?
Perhaps that customer bought much more.
Perhaps Quanto gained a large order while other customer relationships grew more slowly.
Perhaps the mix changes again next year.
The prospectus gives us the numbers. It does not give us enough evidence to predict exactly how this concentration will evolve.
So we should not invent an answer.
Instead, we now know exactly what to monitor.
Are these customers locked in?
Now we reach another important part of the prospectus.
Quanto states that it has not entered into long-term agreements with the majority of these customers.
The company therefore depends on maintaining ongoing relationships with them.
Its prospectus also states that the loss of a significant customer may materially affect operations and cash flows.
That disclosure matters because two businesses can both have 55% concentration and still carry very different economic risks.
Imagine Company X sells a specialised component.
Its largest customer contributes 55% of revenue, but changing suppliers requires two years of testing, regulatory approvals and redesign.
Now imagine Company Y.
Its largest customer also contributes 55%, but the product is relatively standard, alternatives are available and orders are placed periodically without a long-term purchase commitment.
The percentage is the same.
The relationship is not.
So after finding customer concentration, the next question should be:
Why does the customer keep buying from this company?
Price?
Product quality?
Special technology?
Long qualification cycles?
Location?
Supply reliability?
Or simply an ongoing commercial relationship?
The harder a supplier is to replace, the more durable a concentrated relationship may be.
There is another side to the story
A good analysis should not take one risk disclosure and turn it into a verdict.
Quanto provides important context elsewhere in its prospectus.
The company says its customer base comprises multiple independent entities across different years and that no single customer relationship is considered irreplaceable.
It also says it continues to focus on broadening its customer base to reduce concentration risk.
That is management’s position, and it deserves to be included.
But investors do not have to choose between two extreme conclusions:
“The customer will leave.”
or
“The relationship is completely safe.”
The prospectus establishes neither.
The useful conclusion today is simpler:
Quanto currently depends heavily on a small number of customers, and the largest customer’s importance increased substantially in FY26.
That is a fact we can track after the IPO.
Now bring cash into the picture
Customer concentration becomes more useful when we stop looking at it in isolation.
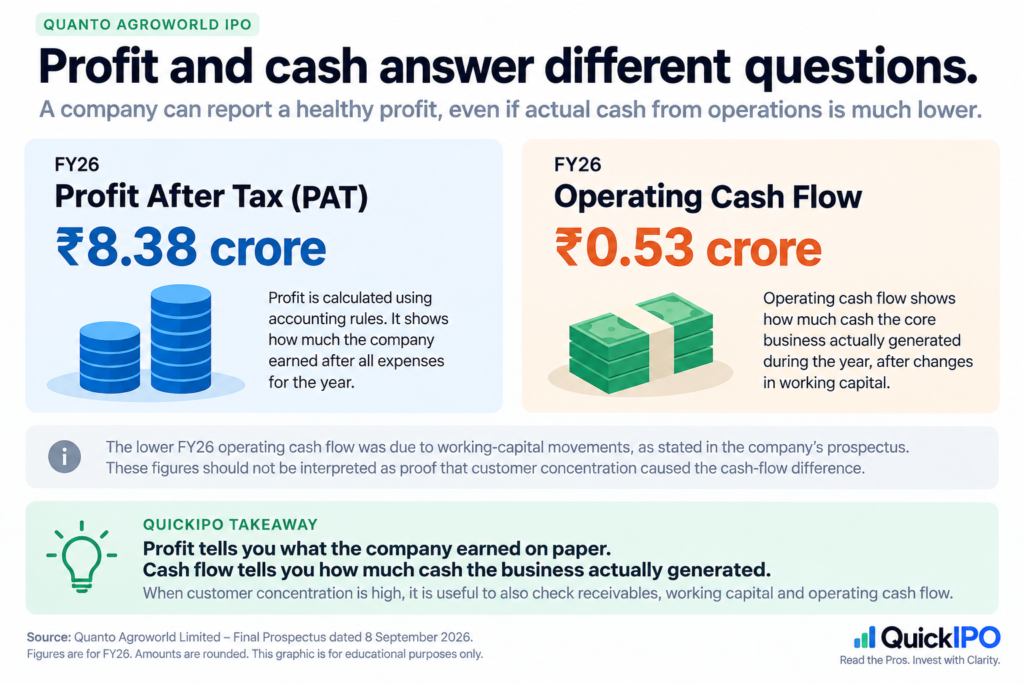
Quanto reported approximately ₹8.38 crore of profit after tax in FY26.
But net cash generated from operating activities in the same year was only about ₹0.53 crore.
Those numbers tell us two different things.
Profit is calculated using accounting rules.
Operating cash flow asks a more immediate question:
How much cash did the core business actually generate during the year?
The prospectus explains that FY26 operating cash flow was affected by working-capital movements.
It is important not to jump one step too far here.
The prospectus does not prove that customer concentration caused the low FY26 operating cash flow.
These are separate disclosures.
But they belong in the same investigation because concentrated customers can influence not only how much a company sells, but also payment terms, receivables and working-capital requirements.
This is why reading an IPO is more useful when we connect numbers instead of treating each table separately.
What if the largest customer simply buys less?
Let’s use a simple example.
This is not a forecast for Quanto. It is only a way to understand the risk.
Assume a business earns ₹100.
Its largest customer contributes ₹54.57.
Now imagine that customer does not leave completely.
It simply cuts its purchases by half.
The business loses approximately ₹27.29 of revenue.
Revenue would fall from ₹100 to about ₹72.71 if nothing else changed and the company found no replacement sales.
But there is another problem.
Costs may not fall at the same speed.
A company may still have to pay employees, maintain facilities, service debt, depreciate machinery and carry administrative expenses.
So a 27% decline in revenue can sometimes produce a much larger percentage decline in profit.
The exact effect depends on the company’s cost structure.
But this is why one large customer can matter much more than its revenue percentage first suggests.
Of course, the opposite can happen too
Suppose a large customer reduces orders.
Quanto could potentially find new buyers and replace those sales.
If that happens quickly, today’s concentration may prove temporary.
That is why concentration should not automatically become a red or green label.
The more useful approach is to watch what happens next.
What should we watch after the IPO?
For Quanto, these are the numbers that will tell the story over time:
- Largest customer contribution: does it move down from 54.57%, stay around the same level, or rise further?
- Top-5 and Top-10 concentration: is the customer base becoming broader?
- Revenue growth: can Quanto keep growing while reducing dependence on its biggest buyers?
- Receivables and operating cash flow: are reported sales converting into cash more effectively?
- New customer additions: does the company disclose evidence that it is successfully broadening its customer base?
One year’s percentage is interesting.
The direction over several years is much more useful.
This lesson is bigger than Quanto Agroworld
This is why a live IPO can teach us more than a textbook definition.
You could memorise:
“Customer concentration measures how much revenue comes from a small number of customers.”
Correct.
But you will probably forget it.
Instead, remember this:
Quanto earned about ₹40.35 crore in FY26. Roughly ₹22.02 crore came from one customer.
Now the idea becomes difficult to forget.
The next time you open an IPO prospectus and see:
Top 5 customers: 75%
don’t stop there.
Ask how much comes from the largest customer.
Check whether concentration is rising or falling.
Find out whether customer relationships are contractual or largely order-based.
Ask why customers stay.
Then connect the sales numbers with receivables and operating cash flow.
That is how a small table buried inside a prospectus becomes useful business analysis.
So, if Quanto’s biggest customer reduces orders, does the business still stand?
We do not know.
And today, that is the responsible answer.
The prospectus does not say Quanto’s largest customer plans to reduce or stop purchases.
It also does not provide enough evidence to conclude that ₹22 crore of annual customer revenue could be replaced immediately if the relationship changed.
What the prospectus does tell us is factual:
54.57% of FY26 revenue came from the largest customer.
85.49% came from the top five.
88.67% came from the top ten.
And the company says it does not have long-term agreements with the majority of these customers.
That is enough to make customer concentration an important part of the Quanto story.
Not a verdict.
A question worth following.
QuickIPO takeaway
When you see a prospectus say:
“Top 10 customers contribute 88.67% of revenue”
don’t immediately ask:
“Is 88.67% too high?”
Ask:
“Who is inside that 88.67%, why do they keep buying, and how easily could the business replace them if something changes?”
The concentration percentage tells you where to investigate.
Understanding the relationship tells you why it matters.
Read the full IPO research
This article explains one specific business risk. For the issue size, financials, valuation, use of IPO money, similar IPOs and complete evidence trail, read our Quanto Agroworld IPO research.
Sources & evidence
1. Quanto Agroworld Limited — Final Prospectus dated 8 September 2026.
Primary source used for FY24–FY26 revenue, customer concentration, customer-agreement disclosures, financial statements and cash-flow information.
2. BSE — Quanto Agroworld Limited offer-document filing.
View the company’s BSE-filed draft prospectus.
3. QuickIPO — Quanto Agroworld IPO research.
View the QuickIPO evidence-based IPO page.
Figures in this article are based on the company’s disclosed offer documents. Statements about potential customer loss or reduced orders are explanatory scenarios only and are not predictions that any customer will leave, reduce purchases or default.
QuickIPO explains publicly disclosed information for educational purposes. This article is not investment advice and is not a recommendation to apply for, avoid, buy or sell any security.