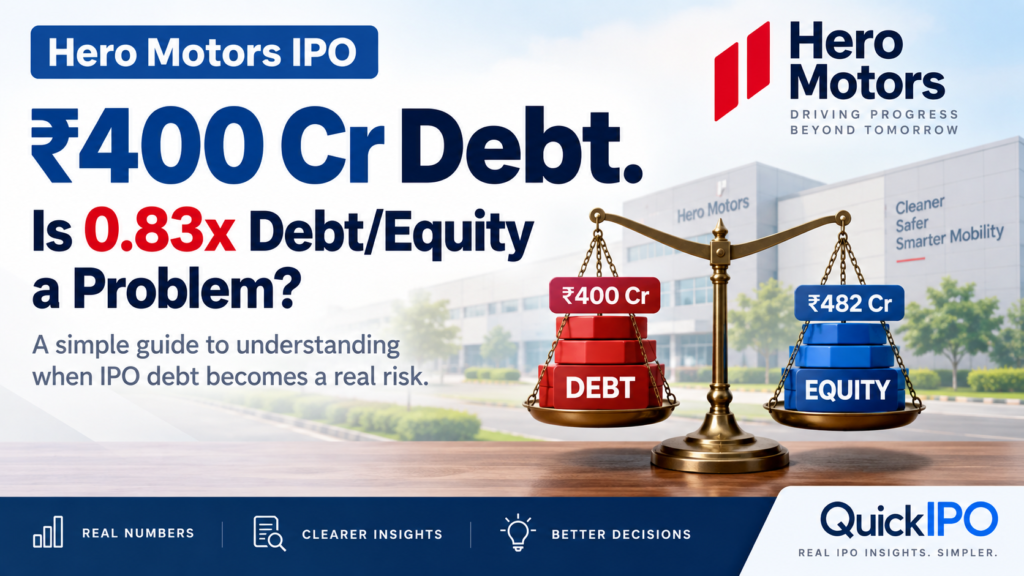
Hero Motors had about ₹400.79 crore of borrowings at the end of FY26.
That sounds like a large number.
But ₹400 crore of debt by itself tells us surprisingly little.
A business with ₹400 crore of debt and strong cash generation may be perfectly capable of servicing it.
Another business with the same ₹400 crore of debt, weak cash flow and falling profits may be under serious financial pressure.
So the useful question is not:
“Does Hero Motors have a lot of debt?”
The better question is:
“How difficult would this debt become if the business had one bad year?”
That question takes us much closer to what debt actually means for an IPO investor.
First, what does debt/equity actually mean?
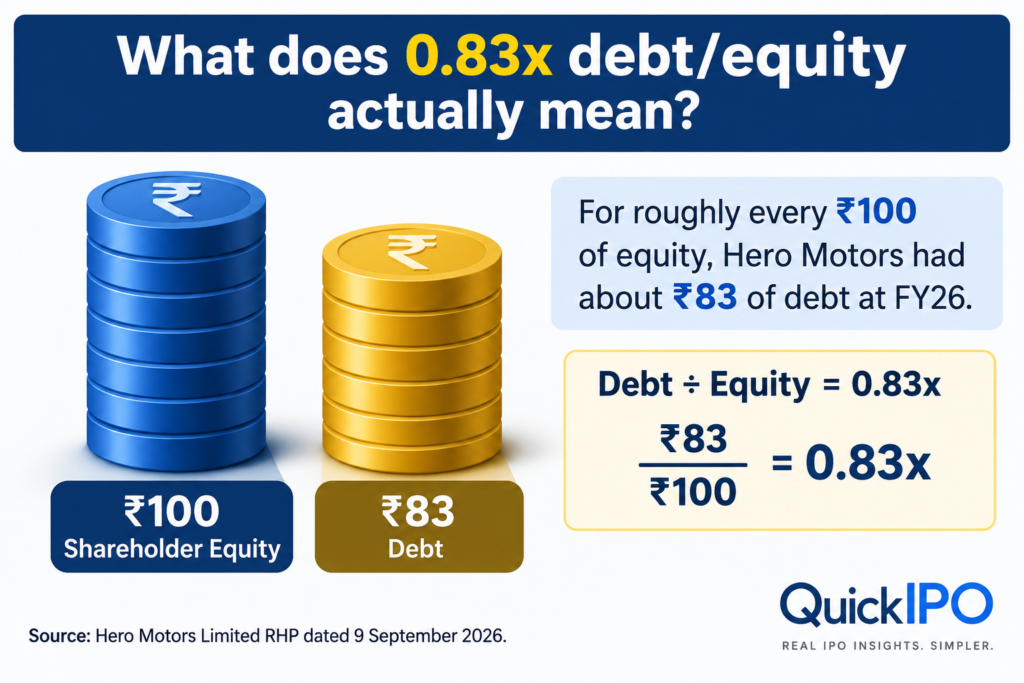
Hero Motors reported a debt/equity ratio of 0.83x in FY26.
If you have never studied finance, 0.83x probably means nothing.
So forget the formula for a moment.
Imagine a company funded with roughly:
₹100 from shareholders
and
₹83 of debt.
That is the basic intuition behind a debt/equity ratio of 0.83x.
The formula is:
Debt ÷ Equity
But knowing the formula is the easy part.
The difficult part is deciding whether that debt is comfortable for the business carrying it.
Is 0.83x high?
There is no universal answer.
A debt/equity ratio of 0.83x can mean very different things for different businesses.
A manufacturing company with predictable orders, healthy margins and strong cash generation may comfortably carry it.
A highly cyclical company with thin margins and unstable cash flows may find the same leverage much harder to manage.
And banks or NBFCs should not be analysed using the same simple framework because borrowing is part of their core business model.
This is why rules such as:
“Debt/equity above 1 is bad.”
sound useful, but can be misleading.
Instead, let’s use Hero Motors to understand what we should actually investigate.
Start with the direction of debt
Hero Motors’ total borrowings were approximately:
| Financial year | Total borrowings | Debt/equity |
|---|---|---|
| FY24 | ₹304.00 crore | 0.81x |
| FY25 | ₹407.62 crore | 0.96x |
| FY26 | ₹400.79 crore | 0.83x |
This table already tells us more than the FY26 ratio alone.
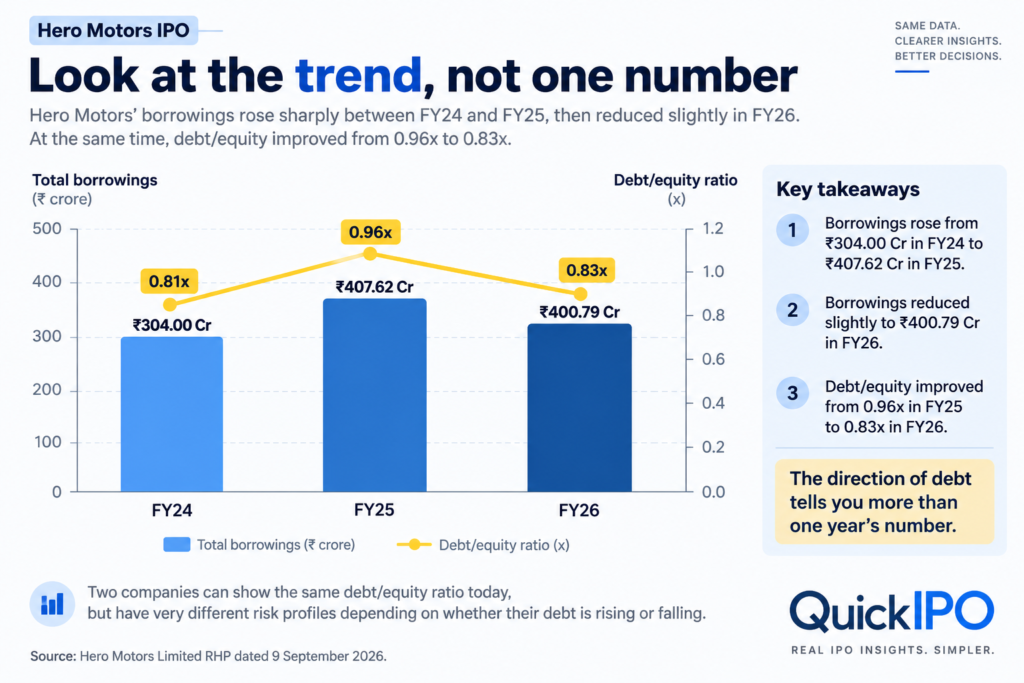
Borrowings rose sharply between FY24 and FY25.
They then reduced slightly in FY26.
At the same time, debt/equity improved from 0.96x to 0.83x.
That is why one year’s number is rarely enough.
Imagine two companies that both report 0.83x debt/equity today.
Company A moved:
1.5x → 1.1x → 0.83x
Company B moved:
0.3x → 0.5x → 0.83x
The current ratio is identical.
The direction is completely different.
Debt becomes real when interest has to be paid
₹400.79 crore is a balance-sheet number.
Interest is where that debt starts affecting the profit and loss statement.
Hero Motors reported FY26 finance costs of approximately ₹40.84 crore.
Its FY26 EBITDA was approximately ₹147.78 crore.
And its restated profit after tax was approximately ₹41.17 crore.
Notice something interesting.
The annual finance cost itself was almost as large as the company’s final profit after tax.
That does not automatically mean the debt is excessive.
But it shows why ignoring finance cost can give us an incomplete picture of profitability.
Why one bad year matters
Suppose an imaginary company normally generates:
EBITDA = ₹150 crore
Interest = ₹40 crore
The business appears to have reasonable room to pay interest.
Now imagine demand weakens.
Revenue falls.
Margins compress.
EBITDA falls to ₹80 crore.
But the bank does not normally say:
“Your sales fell, so you can pay only half your interest this year.”
The financing obligation remains.
Suddenly ₹40 crore of interest consumes half of the ₹80 crore EBITDA.
This is one of the fundamental differences between debt and equity.
Shareholders participate in whatever profit remains.
Lenders expect their contractual payments regardless of whether the year was excellent or disappointing.
That is why the real test of debt is often not:
“Can the company pay today?”
but:
“Could the company still pay comfortably after a difficult year?”
Now check the cash
Debt is not repaid with accounting profit.
Ultimately, it has to be serviced with cash.
Hero Motors reported FY26 operating cash flow of approximately ₹144.04 crore.
Compare that with FY26 profit after tax of approximately ₹41.17 crore.
In this particular year, operating cash generation was considerably higher than reported PAT.
That is useful context when studying debt.
Imagine two other companies, each carrying ₹500 crore of debt.
| Company A | Company B | |
|---|---|---|
| PAT | ₹100 crore | ₹70 crore |
| Operating cash flow | ₹20 crore | ₹120 crore |
| Debt | ₹500 crore | ₹500 crore |
Company A looks better if you only compare profits.
But if the question is:
“Which business is generating more cash that could potentially service debt?”
the picture changes.
This is why, when meaningful debt exists, QuickIPO should put these three numbers next to each other:
Debt → Finance cost → Operating cash flow
Why did the company borrow?
This question is often more useful than the debt/equity ratio itself.
Borrowing money is not automatically a bad thing.
Imagine a manufacturer borrows ₹100 crore to build a plant.
If that plant eventually generates ₹30 crore of sustainable annual operating earnings, the debt helped create a productive asset.
Now imagine another business borrowing repeatedly because customers are not paying, losses continue and the company needs new loans simply to keep operating.
The amount borrowed may be identical.
The economic story is not.
So whenever you see debt in an IPO, ask:
“What did the borrowed money actually finance?”
Now the IPO itself becomes interesting
Hero Motors’ offer is structured as a combination of a fresh issue and an Offer for Sale.
The RHP provides for a fresh issue aggregating up to ₹600 crore and an Offer for Sale aggregating up to ₹400 crore.
This distinction matters.
Money raised through the fresh issue goes to the company, subject to issue expenses and the stated objects of the offer.
Money from the Offer for Sale goes to the selling shareholders.
Hero Motors does not receive the OFS proceeds.
So a ₹1,000 crore IPO does not mean Hero Motors suddenly receives ₹1,000 crore of cash.
That is an important distinction for any IPO investor to understand.
Where is Hero Motors planning to use the fresh money?
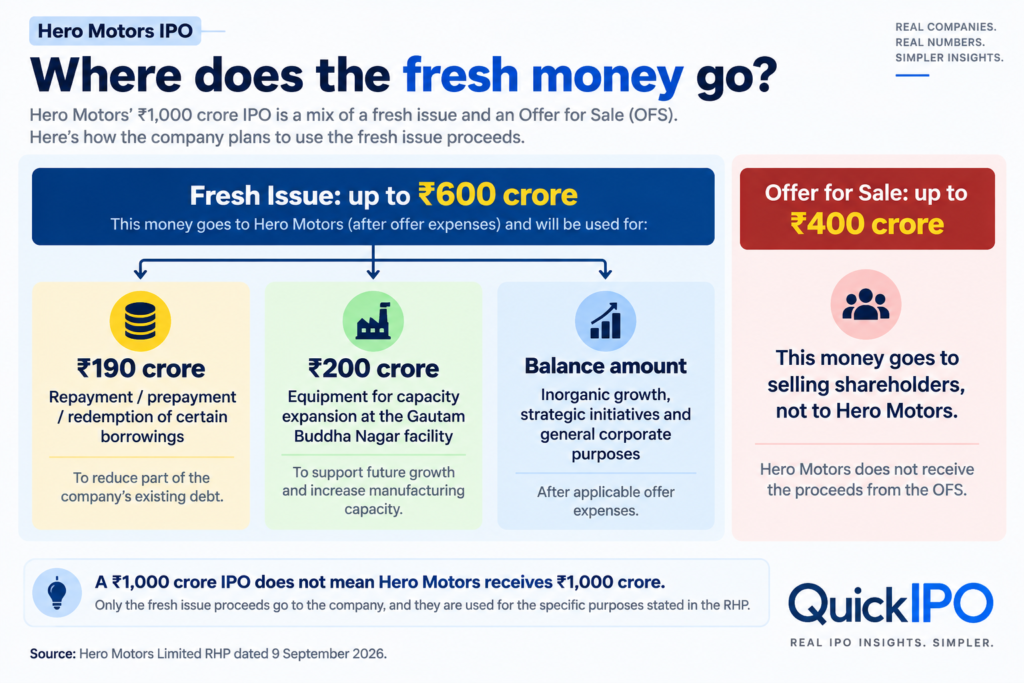
The RHP states that Hero Motors proposes to use approximately:
| Object | Planned amount |
|---|---|
| Repayment / prepayment / redemption of certain borrowings | ₹190 crore |
| Equipment for capacity expansion at the Gautam Buddha Nagar facility | ₹200 crore |
| Inorganic growth, strategic initiatives and general corporate purposes | Balance of applicable net proceeds |
This gives us a useful connection.
The company is simultaneously planning to:
reduce part of its existing borrowing
and
invest in additional capacity.
Those two things should eventually be studied together.
If debt falls and the new capacity generates additional cash, the balance sheet may look different after the IPO.
If fresh expansion requires substantial additional borrowing later, the picture could change again.
We cannot know the final outcome today.
Future filings will tell us.
Don’t subtract ₹190 crore blindly
This is another common mistake.
Hero Motors had approximately ₹289.55 crore of standalone outstanding borrowings as of July 31, 2026 in the form of term loans and cash credit / WCDL covered by the relevant disclosure, and proposes to use ₹190 crore from net proceeds toward specified borrowings.
It may be tempting to calculate:
₹289.55 crore − ₹190 crore = ₹99.55 crore
and declare that Hero Motors will therefore have ₹99.55 crore of debt after the IPO.
That would be too simplistic.
The July figure and the FY26 consolidated debt figure are not the same measurement basis, and borrowings can also change through repayments, working-capital drawdowns, fresh facilities and normal business activity.
So the proper way to verify the outcome is to wait for the company’s post-IPO financial statements.
Then we can ask:
“Did the promised debt repayment actually reduce financial leverage?”
This is exactly the sort of question QuickIPO’s Promise vs Delivery system should track.
So when does debt become a real problem?
Usually not because one ratio crosses one magical threshold.
Debt becomes much more concerning when several warning signs begin appearing together.
For example:
- Debt keeps increasing.
- Interest cost rises faster than operating profit.
- Operating cash flow remains weak.
- Margins are thin or volatile.
- Large repayments are due soon.
- The business still needs major additional capital expenditure.
- The company keeps refinancing rather than reducing debt.
- The IPO raises money but little of the fresh capital improves the balance sheet or productive capacity.
No single item automatically proves that a company has a debt problem.
But several appearing together can leave the business with much less room for error.
Two companies can have the same debt/equity and completely different risk
Consider two imaginary IPOs.
Both report:
Debt/equity = 1.0x
| Company A | Company B | |
|---|---|---|
| Debt trend | Falling | Rising |
| Operating cash flow | Strong | Weak |
| Interest coverage | Comfortable | Thin |
| IPO proceeds | Meaningful debt repayment | Mainly OFS |
| Future funding | Largely internal | More borrowing likely |
The ratio is identical.
The financial resilience is not.
This is the central lesson.
Debt can even make ROE look better
There is one more concept worth understanding.
Suppose a business requires ₹100 of capital.
Scenario 1:
The shareholders provide the entire ₹100.
The company earns ₹20.
The return on shareholder capital is 20%.
Now imagine the shareholders contribute only ₹50 and the company borrows another ₹50.
If the business performs well, using debt can increase the return generated on shareholders’ own money.
But interest now has to be paid.
If profits fall sharply, leverage works in the opposite direction.
This is why high ROE should sometimes be examined alongside leverage rather than celebrated in isolation.
A beginner only needs six questions
You do not need to become a credit analyst to understand IPO debt.
- How much debt exists?
Look at the actual rupee amount, not only the ratio. - Is debt rising or falling?
Compare at least three years when the prospectus provides them. - How much does interest cost?
Debt is easier to carry when operating earnings comfortably cover financing costs. - Is the business producing cash?
Compare profit with operating cash flow. - Why was the money borrowed?
Productive expansion and recurring financial stress are not the same thing. - What changes after the IPO?
Separate Fresh Issue from OFS and see where the company’s fresh money is actually going.
If you understand these six questions, debt/equity becomes far more useful.
So, is Hero Motors’ debt a problem?
The current disclosures do not justify a simple yes-or-no answer.
What we can establish from the RHP is that Hero Motors had approximately ₹400.79 crore of FY26 borrowings and a 0.83x debt/equity ratio.
Its FY26 operating cash flow was approximately ₹144.04 crore, while finance costs were approximately ₹40.84 crore.
The company also proposes to use ₹190 crore of net IPO proceeds toward repayment, prepayment or redemption of certain borrowings.
At the same time, Hero Motors remains a capital-intensive manufacturing business and proposes to spend another ₹200 crore on equipment for capacity expansion.
So the interesting question after the IPO is not:
“Did Hero Motors have debt before listing?”
It is:
“Did the IPO actually reduce financial pressure, and did the capital invested in expansion eventually produce stronger cash flows?”
Future filings can answer that.
QuickIPO takeaway
When you see:
Debt/equity = 0.83x
don’t immediately ask:
“Is 0.83 good or bad?”
Ask:
“If earnings fall for one difficult year, can this business still comfortably pay its lenders and continue investing?”
Then follow this sequence:
Debt → Interest → Cash flow → Repayment → Future borrowing
A debt number tells you how much the company owes.
Understanding the business tells you whether that obligation is easy or difficult to carry.
What QuickIPO will watch after the IPO
- ₹190 crore debt repayment: was the stated repayment/prepayment actually completed?
- Total borrowings: did debt materially reduce after the IPO?
- Finance costs: did the interest burden fall?
- Debt/equity: did leverage improve?
- Operating cash flow: did cash generation remain healthy?
- ₹200 crore capacity expansion: did the investment translate into productive capacity and stronger business results?
- Future borrowing: was the next stage of growth funded internally or with additional debt?
This turns a one-time IPO disclosure into something investors can verify later.
Read the full IPO research
This article explains one part of the Hero Motors IPO. For the complete business, financials, valuation, use of IPO proceeds, risks, similar IPOs and evidence trail, read the Hero Motors IPO research on QuickIPO.
Sources & evidence
Hero Motors Limited — Red Herring Prospectus dated 9 September 2026.
Primary source for the offer structure, borrowings, debt/equity ratio, financial statements, cash flows, finance costs and proposed use of fresh-issue proceeds.
SEBI — Hero Motors Limited RHP filing, September 2026.
Official public-issue filing record.
National Stock Exchange of India — Hero Motors Limited Issue Information.
Official exchange source for the IPO issue period and issue information.
Illustrative examples in this article are simplified teaching examples and are not forecasts of Hero Motors’ future revenue, profit, debt, interest expense or cash flow.
QuickIPO explains publicly disclosed information for educational purposes. This article is not investment advice and is not a recommendation to apply for, avoid, buy or sell any security.